Understand Your Organization's Snowflake Utilization With Snowflake Usage Analytics
Get Pricing Information
Snowflake Usage Analytics
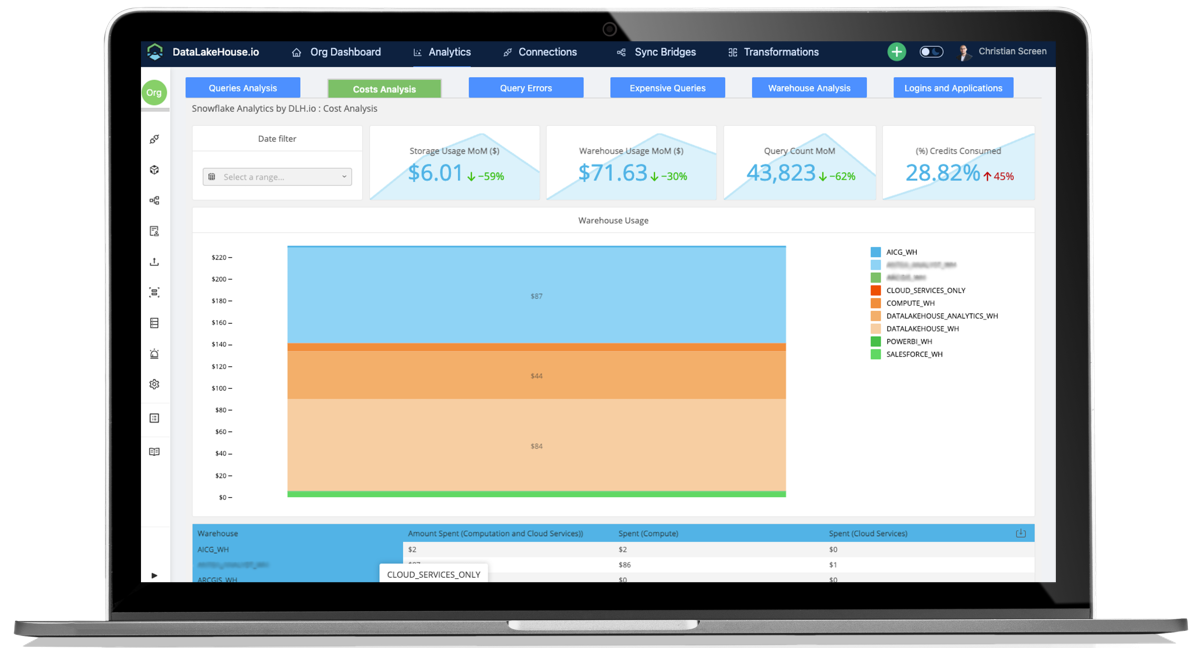
Get better insight into your Snowflake spend and your end user experience without having to write SQL queries. DataLakeHouse.io has built-in Snowflake usage analytics to view trends and drill into long running queries which may be a sign of a poor end user experience.
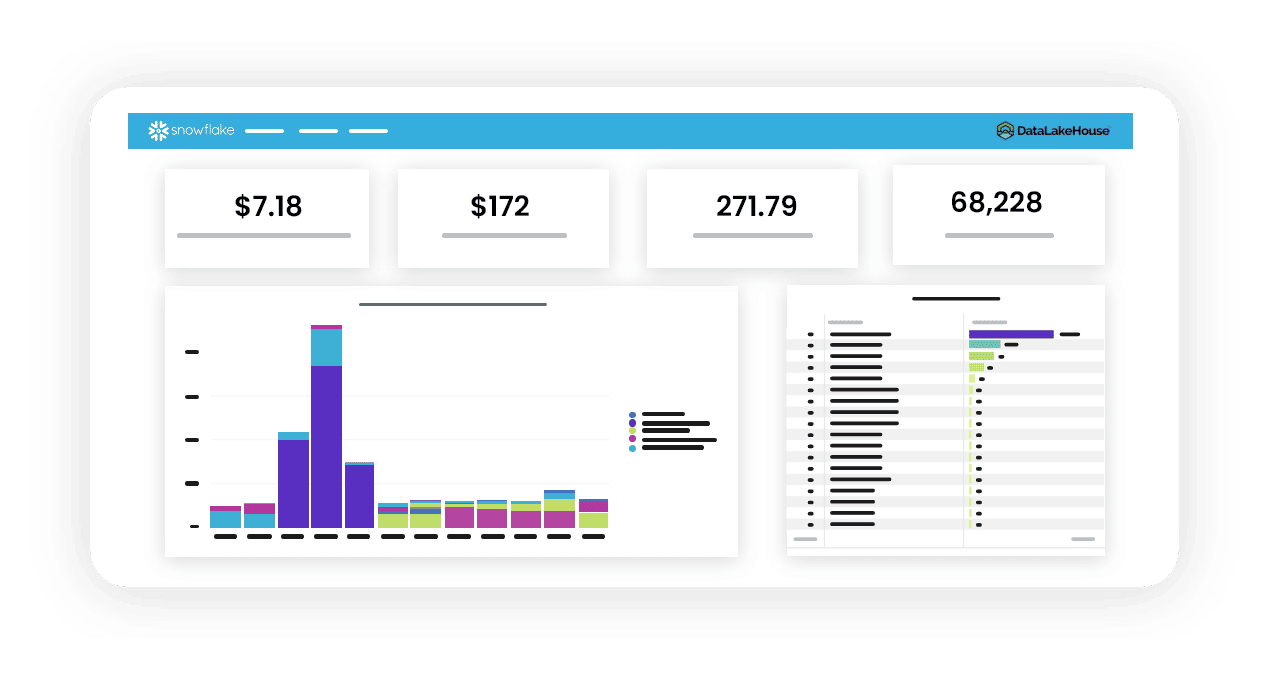
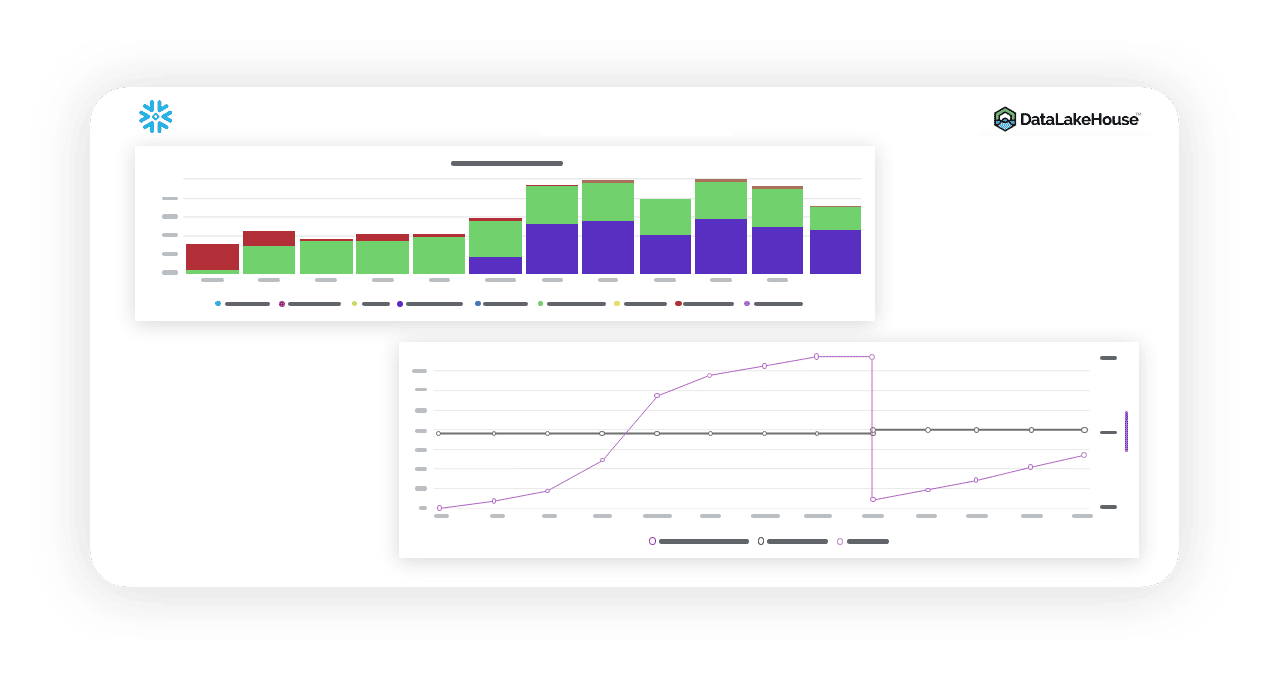
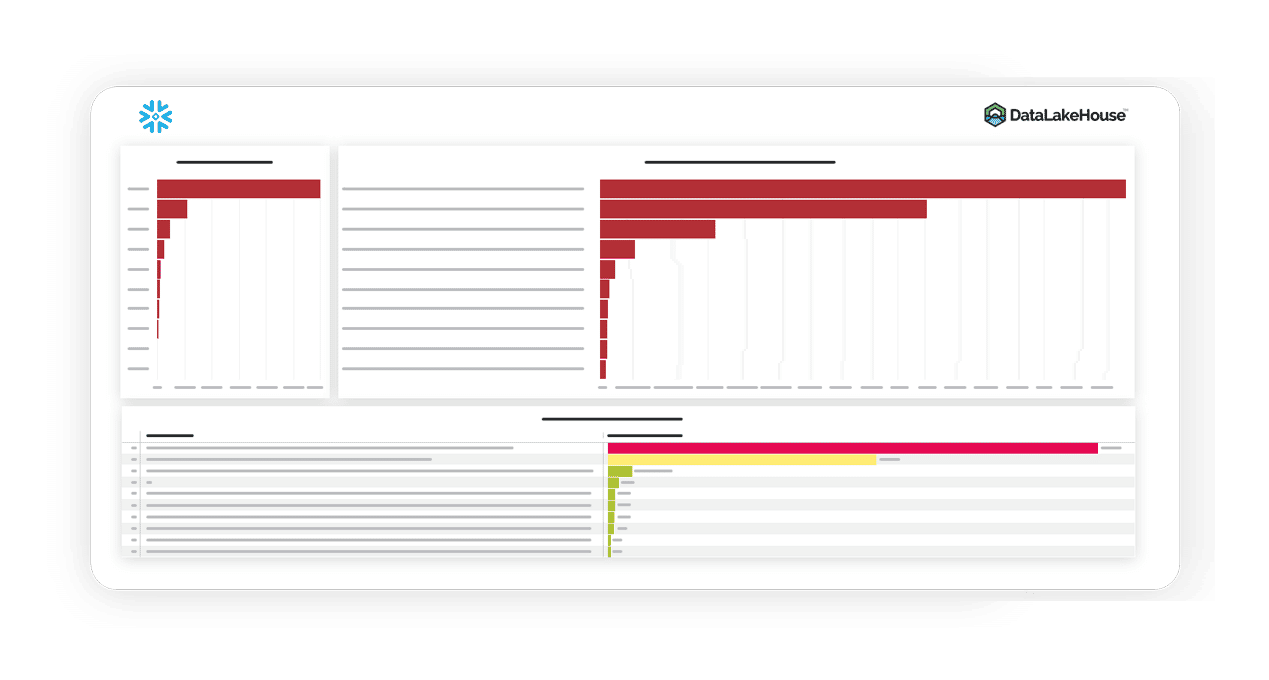
View Snowflake spend by Account, by Warehouse, by User, by Calendar
See Snowflake consumption trends
Charge back to user groups based upon consumption level
Compare actual usage to purchased credits
Introducing Usage Analytics for Snowflake
Webinars
Watch a Snowflake
Usage Analytics Demo
Made with Glorious Purpose in the Carolinas
We ❤ Data Teams.

DataLakeHouse.io is a Data Orchestration and Data Security Platform built for People and Customer Insights. As an end-to-end analytics platform it offers a suite of data tools including ELT and PII Data Security, industry-specific pre-built Models with reporting, and AI/Machine Learning to offer actionable insights and predictions for extremely effective business decision-making.
PLATFORM
Compare Data Automation
Use Cases
Industry Solutions
Insights from your data and moving data in and out of your core operational systems should be effortless. Spend your team’s time on high-value target efforts that move the needle for your initiatives. Let DataLakeHouse.io handle the basics with our well-supported ELT and Analytics, Algorithms, Functions, and knowledge of data relationships so you don’t have to.


